Technical Indicators
How chart-based indicators like moving averages, RSI and MACD are built and read — for education, not trading signals.
11 articles

Technical Indicators
VWAP (Volume Weighted Average Price), Explained
VWAP blends price and volume into a single intraday benchmark that big institutions watch closely. Here's how it's calculated, how it's used, and its limits.
8 min read
Technical Indicators
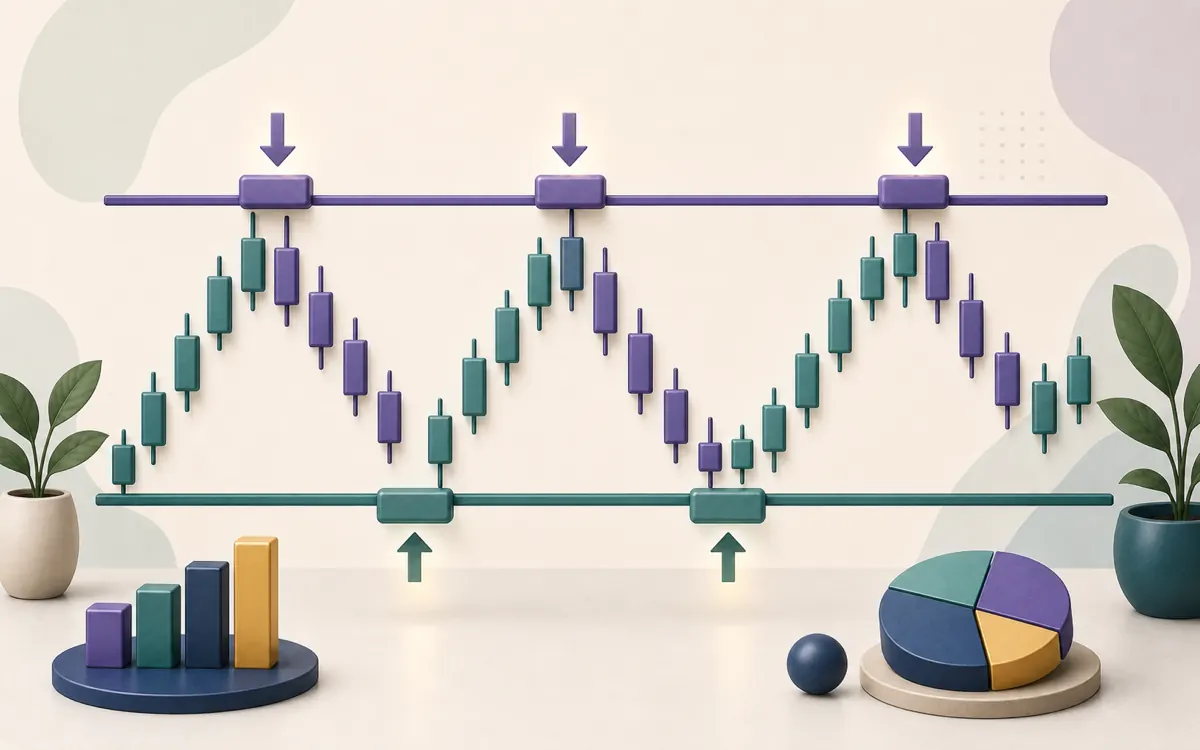
Support and Resistance, Explained
Support and resistance are the floors and ceilings of a price chart — the most fundamental idea in technical analysis. Here's how they form, how they're used, and how they break.
8 min read
Technical Indicators
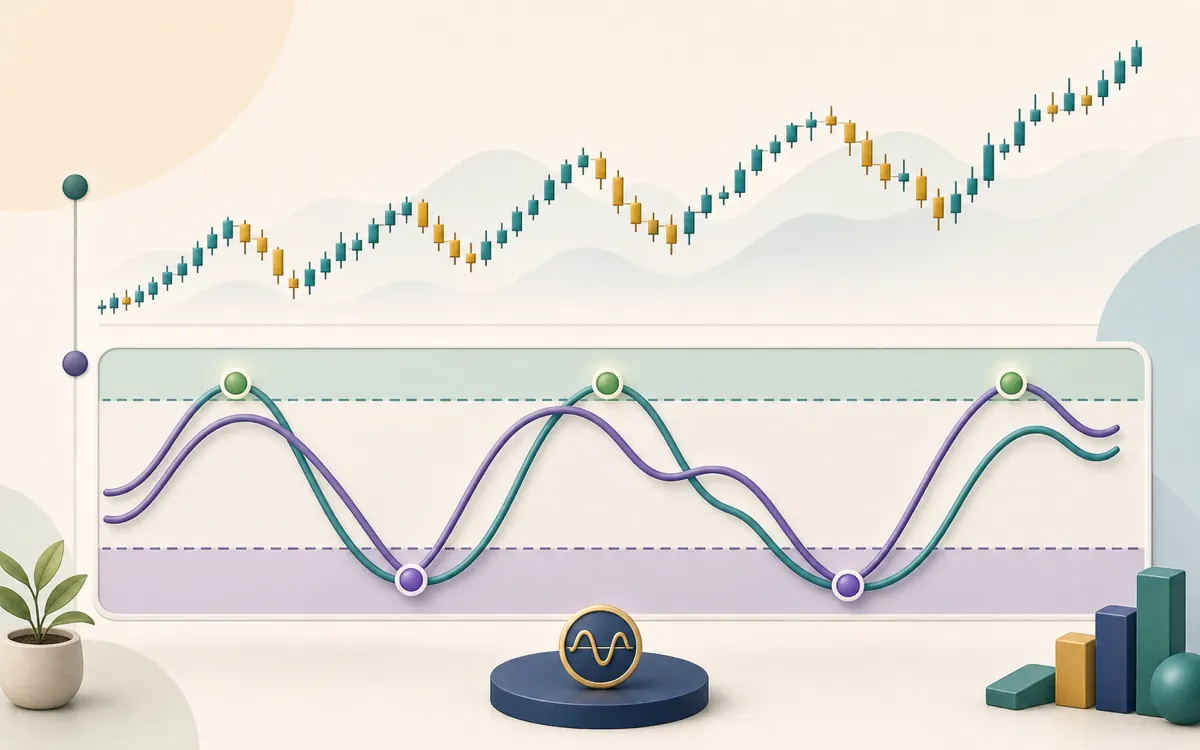
The Stochastic Oscillator, Explained
The Stochastic Oscillator measures where price closes within its recent range to gauge momentum. Here's how its %K and %D lines work — and why 'overbought' doesn't mean 'sell'.
9 min read

Technical Indicators
Margin and Leverage in Trading: How Losses Get Magnified
Leverage can multiply gains — and just as easily wipe out an account. Here's what margin and leverage really are, why they blow up traders, and the risk rules that keep accounts alive.
11 min read

Technical Indicators
Fibonacci Retracement, Explained
Fibonacci retracement marks potential pullback levels within a trend using ratios derived from a famous number sequence. Here's how it's drawn, read, and why it's not magic.
8 min read
Technical Indicators
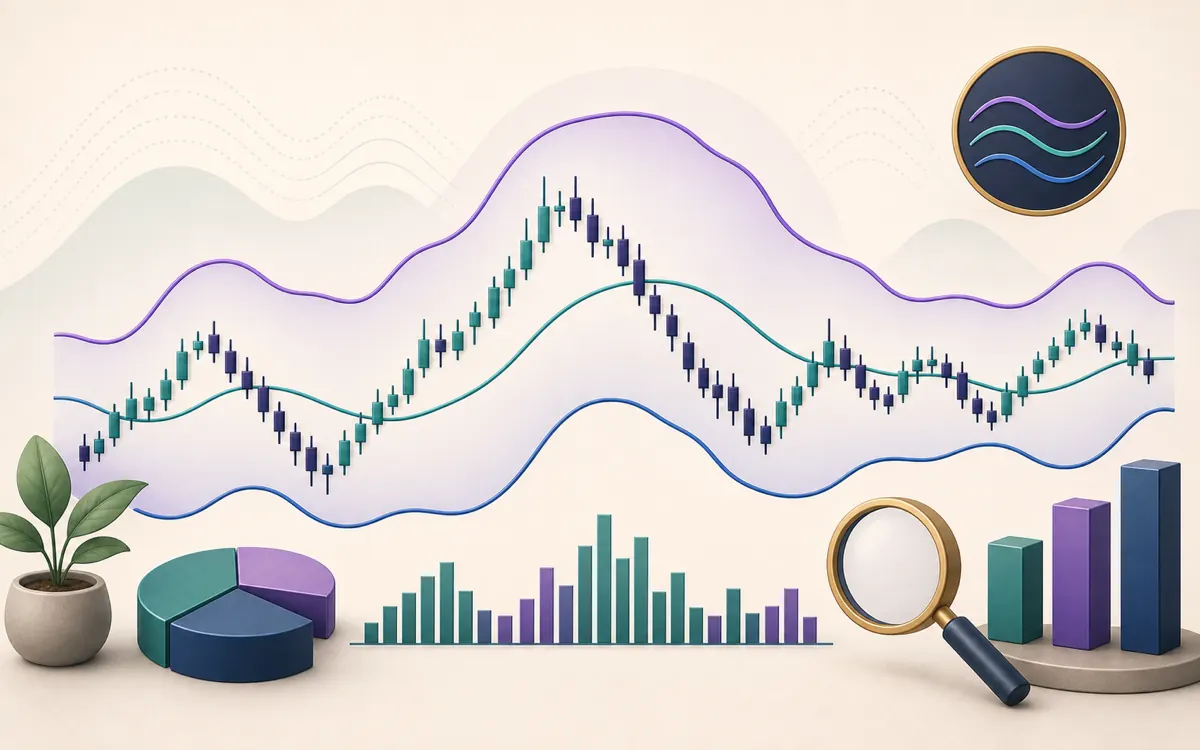
Bollinger Bands, Explained: Volatility on a Chart
Bollinger Bands wrap price in a volatility envelope that widens and narrows with the market. Here's how they're built, what the 'squeeze' means, and where they mislead.
9 min read

Technical Indicators
ADX (Average Directional Index), Explained
The ADX measures how strong a trend is — but not which way it points. Here's how it works alongside its +DI and −DI lines, and how traders read trend strength.
8 min read

Technical Indicators
What Is Technical Analysis? A Plain-English Introduction
Technical analysis studies price and volume to understand market behaviour. Here's what it is, the ideas behind it, and — importantly — its limitations.
6 min read

Technical Indicators
Moving Averages Explained: SMA vs EMA
The moving average is the most widely used indicator of all. Here's how the simple and exponential versions are built, and how they differ.
6 min read
Technical Indicators
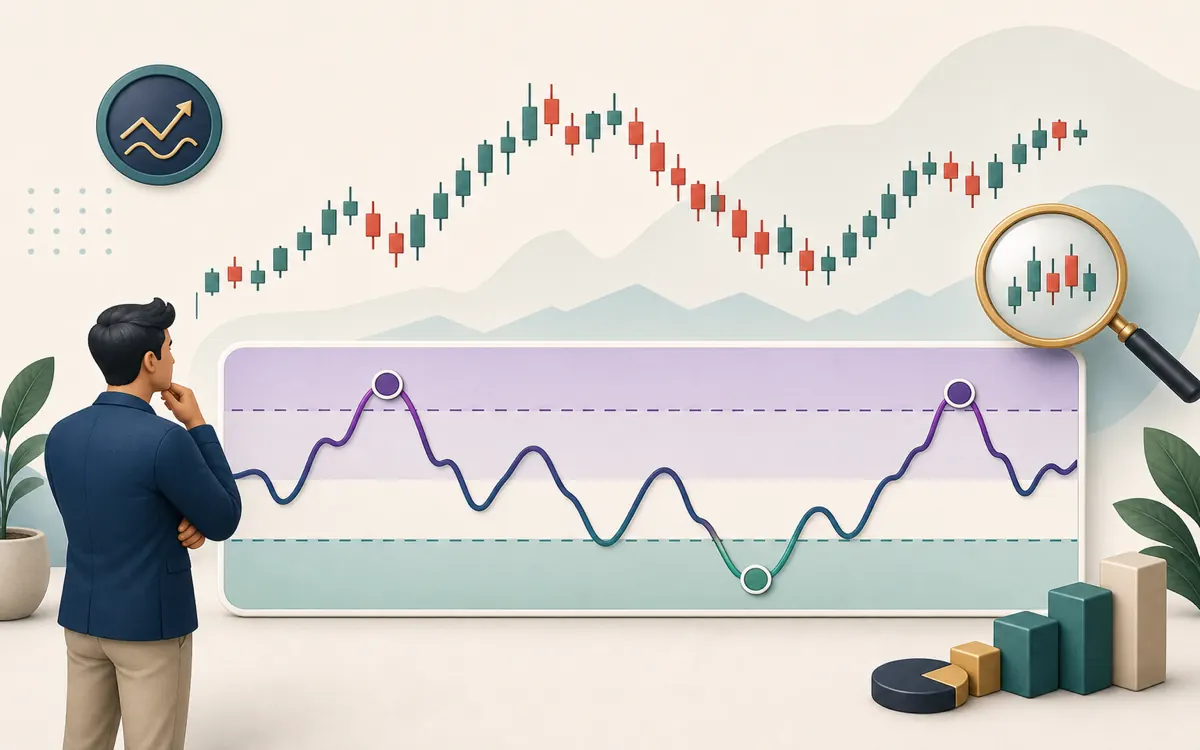
RSI (Relative Strength Index), Explained
The RSI is a momentum gauge that runs from 0 to 100. Here's how it's calculated, what 'overbought' and 'oversold' mean, and where it misleads.
6 min read
Technical Indicators
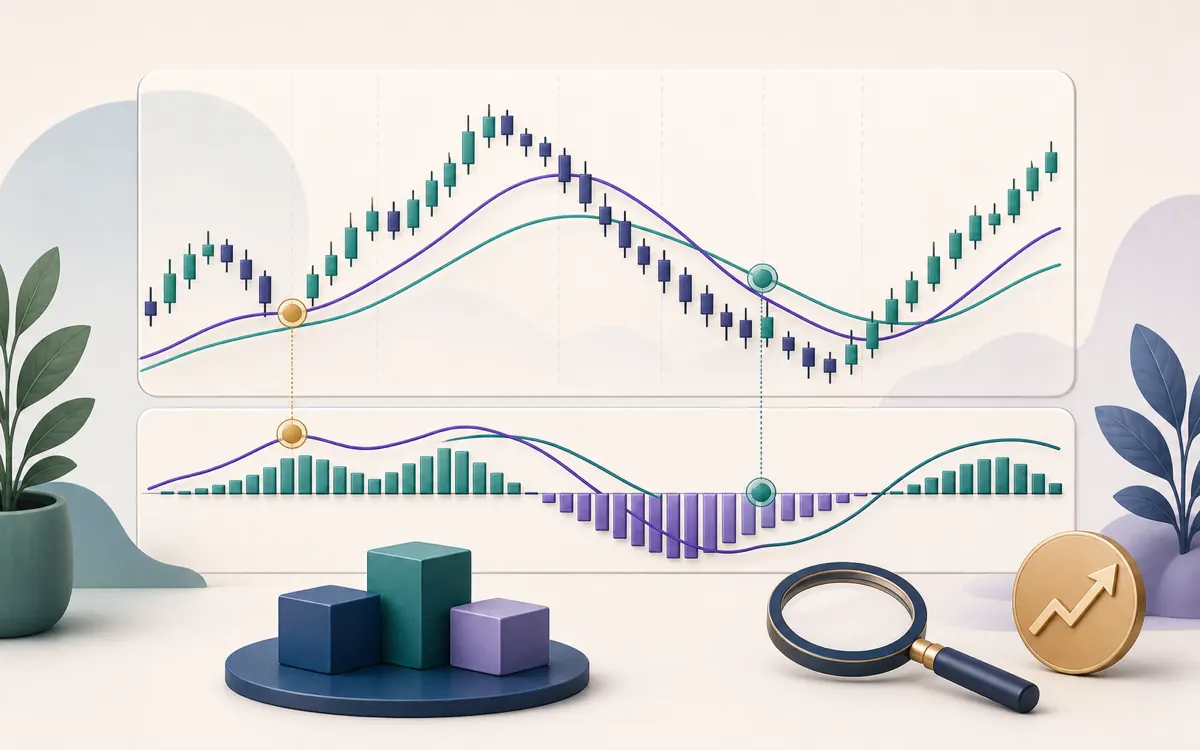
MACD Explained: Moving Average Convergence Divergence
The MACD combines two moving averages into a single momentum indicator. Here's how its line, signal, and histogram are built — and how they're read.
6 min read