Moving Averages Explained: SMA vs EMA
The moving average is the most widely used indicator of all. Here's how the simple and exponential versions are built, and how they differ.

The moving average is the starting point for most technical analysis. It takes a noisy, jagged price line and smooths it into something easier to read, so you can see the broader direction beneath the day-to-day wiggles.
What a moving average does
If you take the average closing price of the last 20 days, then tomorrow drop the oldest day and add the newest, you have a 20-day moving average. Plotted over the price, it forms a smooth line that filters out short-term noise.
The Simple Moving Average (SMA)
The SMA is exactly what it sounds like — a plain average.
SMA = (P1 + P2 + ... + Pn) / n
Here P is the closing price for each period and n is the number of periods. A 50-day SMA adds up the last 50 closing prices and divides by 50. Every day in the window counts equally — the price from 50 days ago matters just as much as yesterday's.
The Exponential Moving Average (EMA)
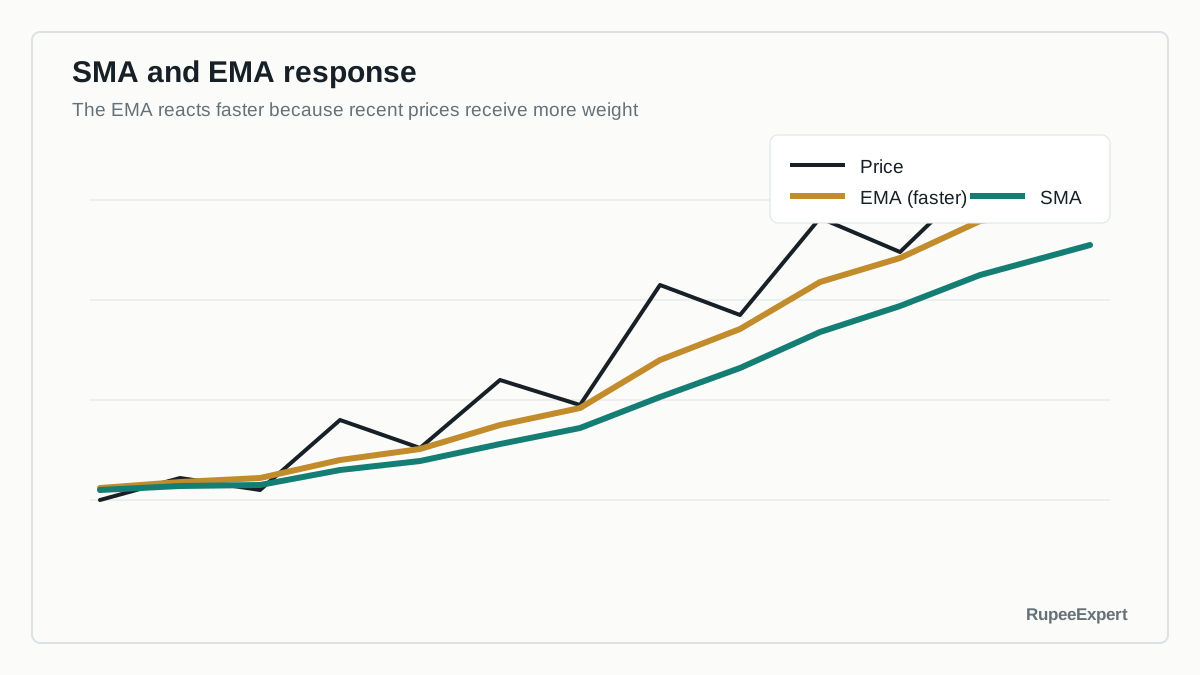
The EMA addresses a common complaint about the SMA: that treating old prices the same as new ones makes it sluggish. The EMA gives more weight to recent prices, so it turns more quickly when the trend changes.
The calculation applies a weighting multiplier to the latest price and carries forward the previous EMA:
Multiplier = 2 / (n + 1)
EMA = (Price today × Multiplier) + (EMA yesterday × (1 − Multiplier))
For a 10-period EMA, the multiplier is 2 / 11 ≈ 0.18, so today's price gets about 18% of the weight and the running average supplies the rest. The result hugs the price more closely than an SMA of the same length.
How moving averages are read
Analysts use moving averages in a few common ways:
Whichever length is chosen, define what one "period" means. A 20-period average can represent 20 minutes, 20 days, or 20 months. The calculation is identical but the decision horizon is completely different. Changing the timeframe after seeing the result is another form of fitting the tool to the answer.
- Trend direction. A rising average suggests an up-trend; a falling one suggests a down-trend.
- Dynamic support and resistance. Price sometimes reacts around a widely watched average, such as the 200-day.
- Crossovers. When a shorter average crosses a longer one, some treat it as a change in momentum. A short-above-long crossover is often nicknamed a "golden cross," and the reverse a "death cross."
SMA or EMA — which is better?
Neither is universally better; they trade off smoothness against responsiveness. The EMA reacts faster, which can mean earlier signals but also more false alarms in choppy markets. The SMA is steadier but slower. The right length and type depend entirely on what you are trying to observe.
The big limitation
Every moving average is lagging — it is built from past prices, so it always confirms a move after it has begun, never before. In sideways, choppy markets, moving-average signals can whipsaw back and forth and lose money for those who trade them mechanically. They describe the trend; they do not predict it.
Common mistakes to avoid
- Trading every crossover mechanically. Crossovers whipsaw badly in sideways markets.
- Ignoring the market context. Moving averages behave very differently in a trend than in a range.
- Assuming the EMA is simply "better." It is just more reactive — which can mean more false signals.
- Treating a lagging tool as predictive. It confirms moves after they start, not before.
Bottom line
The SMA and EMA both turn messy price data into a readable trend line — the SMA by averaging equally, the EMA by favouring recent prices. Understanding the difference helps you interpret any chart that uses them. But remember: this explains how the tool is built, not a signal to act on.
Frequently asked questions
What is the difference between an SMA and an EMA?
A simple moving average (SMA) gives every period in its window equal weight, making it smooth but slow to react. An exponential moving average (EMA) weights recent prices more heavily, so it responds faster to new price action.
Is a moving-average crossover a buy or sell signal?
A crossover is a commonly watched pattern, not a reliable signal. In trending markets it can be informative, but in choppy markets crossovers whipsaw back and forth and lose money for those who trade them mechanically.
Which moving-average length should I use?
It depends on what you are trying to observe. Shorter averages react faster but produce more false signals; longer ones are steadier but slower. There is no single correct setting.
Do moving averages predict price?
No. Every moving average is lagging — built from past prices — so it confirms a move after it has begun rather than before. It describes the trend; it does not predict it.
Sources & further reading
Was this article helpful?