MACD Explained: Moving Average Convergence Divergence
The MACD combines two moving averages into a single momentum indicator. Here's how its line, signal, and histogram are built — and how they're read.
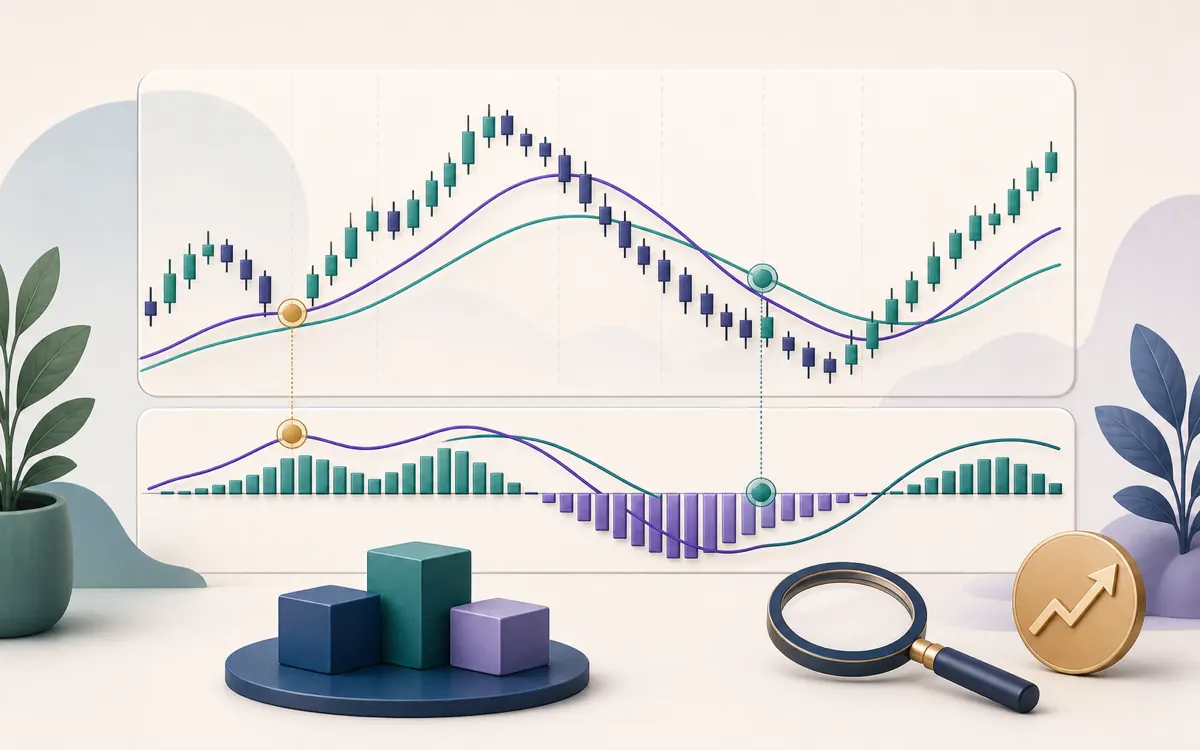
The MACD — Moving Average Convergence Divergence — sounds intimidating, but it is just a clever way of watching two moving averages at once. It packages the relationship between them into a single momentum indicator.
The idea behind it
The MACD is built on a simple observation: when a short-term average pulls away from a longer-term average, momentum is strengthening; when they drift back together, momentum is fading. "Convergence and divergence" simply describes the two averages moving apart and back together.
The three components
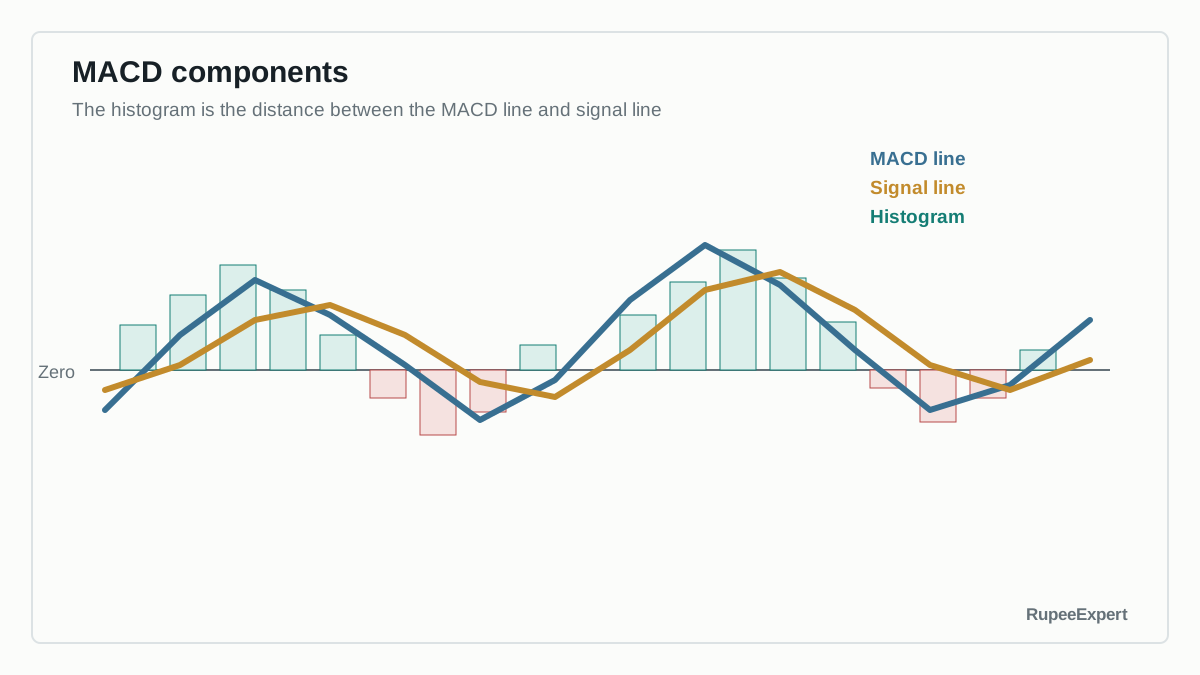
The MACD has three parts, usually shown in a panel below the price chart.
1. The MACD line is the difference between a 12-period EMA and a 26-period EMA:
MACD line = EMA(12) − EMA(26)
When the short EMA is above the long EMA, the MACD line is positive; when below, it is negative.
2. The signal line is a 9-period EMA of the MACD line itself:
Signal line = EMA(9) of the MACD line
It is a smoothed version of the MACD line, used as a reference point.
3. The histogram is the gap between the two:
Histogram = MACD line − Signal line
The bars grow as momentum accelerates and shrink as it fades.
How the MACD is read
A few patterns are commonly discussed:
- Signal-line crossovers. The MACD line crossing above the signal line is read by some as strengthening upward momentum, and a cross below as the opposite.
- The zero line. The MACD line crossing above or below zero marks where the short EMA crosses the long EMA — the same idea as a moving-average crossover.
The histogram does not show price return. It shows only the distance between the MACD and signal lines. A shrinking positive histogram means positive momentum is decelerating; it does not by itself mean price has started falling. This distinction prevents a common misreading of every shorter bar as a bearish event.
- Histogram shifts. A shrinking histogram hints that momentum is slowing even before a crossover happens.
- Divergence. Like the RSI, the MACD can diverge from price, which some read as momentum weakening.
The limitations
Because the MACD is built entirely from EMAs, it inherits their biggest flaw: it lags. It confirms momentum changes after they have started, not before. In sideways, range-bound markets it produces frequent crossovers that lead nowhere — the classic "whipsaw." Treating every crossover as an action is a well-known way to rack up losses.
Common mistakes to avoid
- Treating every crossover as an action. Signal-line crossovers are noisy, especially in ranges.
- Using the MACD in sideways markets. It produces frequent whipsaws when there is no real trend.
- Forgetting it lags. Built from EMAs, it confirms moves after they begin.
- Relying on it in isolation. It is one piece of context, not a standalone trigger.
Bottom line
The MACD elegantly compresses the relationship between two moving averages into a line, a signal, and a histogram, giving a readable picture of momentum. Understanding how those three pieces are calculated lets you interpret any MACD panel you see. As always here, this is an explanation of the tool — not a signal to buy or sell anything.
Frequently asked questions
What are the three parts of the MACD?
The MACD line (the difference between a 12-period and a 26-period EMA), the signal line (a 9-period EMA of the MACD line), and the histogram (the gap between the two). Together they give a readable picture of momentum.
Is a MACD signal-line crossover a buy signal?
It is a commonly watched pattern, not a reliable signal on its own. In sideways markets these crossovers happen frequently and lead nowhere — the classic whipsaw.
Does the MACD lag price?
Yes. Because it is built entirely from EMAs, it inherits their lag and confirms momentum changes after they have started, not before.
How is the MACD different from the RSI?
The MACD tracks the relationship between two moving averages to show momentum and trend, while the RSI compares the size of recent gains and losses on a 0–100 scale. They measure different things and can disagree.
Sources & further reading
Was this article helpful?