RSI (Relative Strength Index), Explained
The RSI is a momentum gauge that runs from 0 to 100. Here's how it's calculated, what 'overbought' and 'oversold' mean, and where it misleads.

The Relative Strength Index, or RSI, is one of the most popular momentum indicators in technical analysis. Developed by J. Welles Wilder, it tries to answer a simple question: is recent buying or selling pressure getting stretched?
What the RSI measures
The RSI compares the size of recent gains to the size of recent losses over a chosen period — most commonly 14 periods. The output is a single line that oscillates between 0 and 100.
How it is calculated
The core formula is:
RS  = Average gain over n periods / Average loss over n periods
RSI = 100 − (100 / (1 + RS))
In words: you average the up-moves and the down-moves over the period, take their ratio (the "relative strength," RS), and convert it to a 0–100 scale. If average gains dominate, the RSI rises toward 100. If losses dominate, it falls toward 0. If gains and losses are roughly equal, the RSI sits near 50.
Overbought and oversold
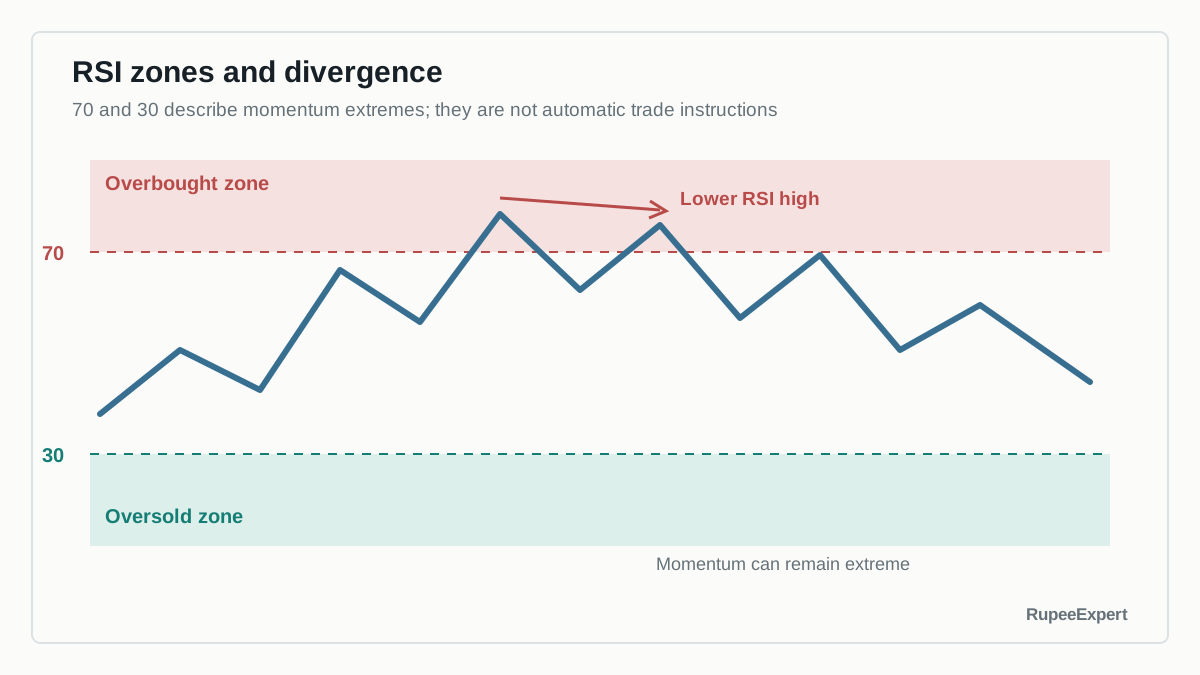
The most quoted levels are 70 and 30.
It is tempting to read "overbought" as "time to sell" and "oversold" as "time to buy." That is exactly the trap to avoid — these are descriptions of momentum, not signals, and acting on them mechanically is how many people lose money.
Divergence
Analysts also watch for divergence, where price and the RSI move in opposite directions. For example, price makes a new high but the RSI makes a lower high, suggesting the up-move is losing strength. Divergence is suggestive, not conclusive — it can persist for a long time before anything happens, if it happens at all.
Divergence is especially vulnerable to hindsight. Two analysts can select different peaks and reach opposite conclusions. To evaluate it honestly, define which highs or lows count before checking what price did next, and include failed examples rather than displaying only the neat successes.
Why the RSI misleads
The RSI's biggest weakness shows up in strong trends. In a powerful up-trend, the RSI can remain above 70 for weeks while the price keeps climbing. Anyone who "sold the overbought signal" would have exited far too early. The same applies in reverse during sharp declines.
This is the recurring lesson of technical indicators: they summarise the recent past, and the past does not bind the future.
Common mistakes to avoid
- Selling every "overbought" reading. In an uptrend the RSI can stay high for a long time — selling early is costly.
- Treating 70 and 30 as automatic triggers. They describe momentum, not actions to take.
- Using the RSI without trend context. The same reading means different things in a trend versus a range.
- Expecting it to predict reversals. It summarises the recent past, which does not bind the future.
Bottom line
The RSI is a neat way to gauge whether recent momentum has been one-sided, expressed on a simple 0–100 scale. Knowing how it is built — and that "overbought" does not mean "sell" — is the difference between understanding the tool and being fooled by it. This is educational only, not a trading recommendation.
Frequently asked questions
What does an RSI above 70 mean?
It is traditionally called 'overbought' — price has risen quickly and momentum may be stretched. Crucially, this is a description of momentum, not a signal to sell. In strong uptrends the RSI can stay above 70 for a long time.
Is an RSI below 30 a buy signal?
No. 'Oversold' below 30 describes one-sided downward momentum, not a recommendation to buy. Acting on it mechanically — especially in a downtrend — is how many people lose money.
Can the RSI stay overbought or oversold for a long time?
Yes. In a powerful trend the RSI can remain stretched for weeks while price keeps moving. This is the indicator's biggest weakness and the reason it can mislead.
What is RSI divergence?
Divergence is when price and the RSI move in opposite directions — for example, price makes a new high but the RSI does not. It is suggestive that momentum may be weakening, but it is not conclusive and can persist for a long time.
Sources & further reading
Was this article helpful?