Bollinger Bands, Explained: Volatility on a Chart
Bollinger Bands wrap price in a volatility envelope that widens and narrows with the market. Here's how they're built, what the 'squeeze' means, and where they mislead.
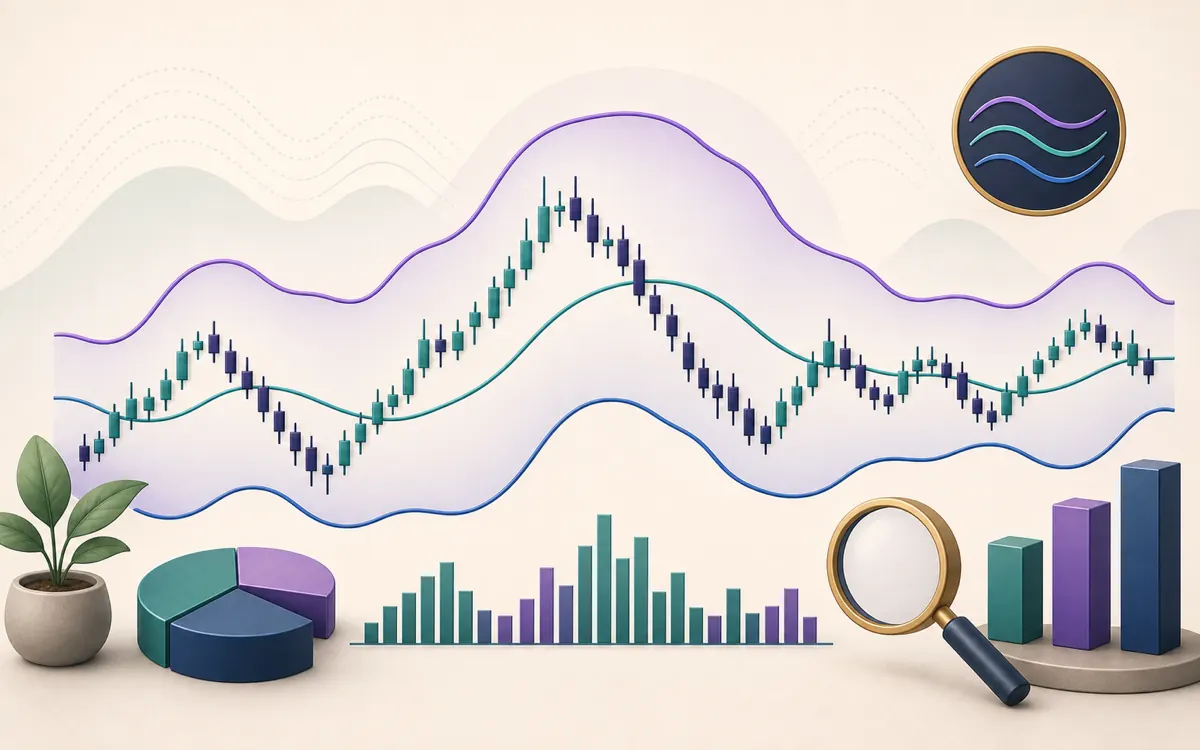
Bollinger Bands, developed by John Bollinger, are one of the most recognisable indicators on any chart — a pair of lines that hug price and breathe in and out as the market calms and churns. They turn the abstract idea of "volatility" into something you can see at a glance.
What Bollinger Bands are
The bands form an envelope around price. Because their distance from the middle line is based on volatility, they widen during turbulent periods and pull in during calm ones — giving you an immediate visual sense of how active the market is.
How they're calculated
The standard settings use a 20-period simple moving average and bands two standard deviations away:
Middle band = 20-period SMA
Upper band  = Middle band + (2 × standard deviation)
Lower band  = Middle band − (2 × standard deviation)
The key ingredient is the standard deviation.
Because the band width is two standard deviations, it automatically reflects recent volatility. When prices are jumping around, the standard deviation grows and the bands spread apart; when prices barely move, the bands close in. The middle line itself is just a moving average, so it shows the underlying trend.
What the bands show you
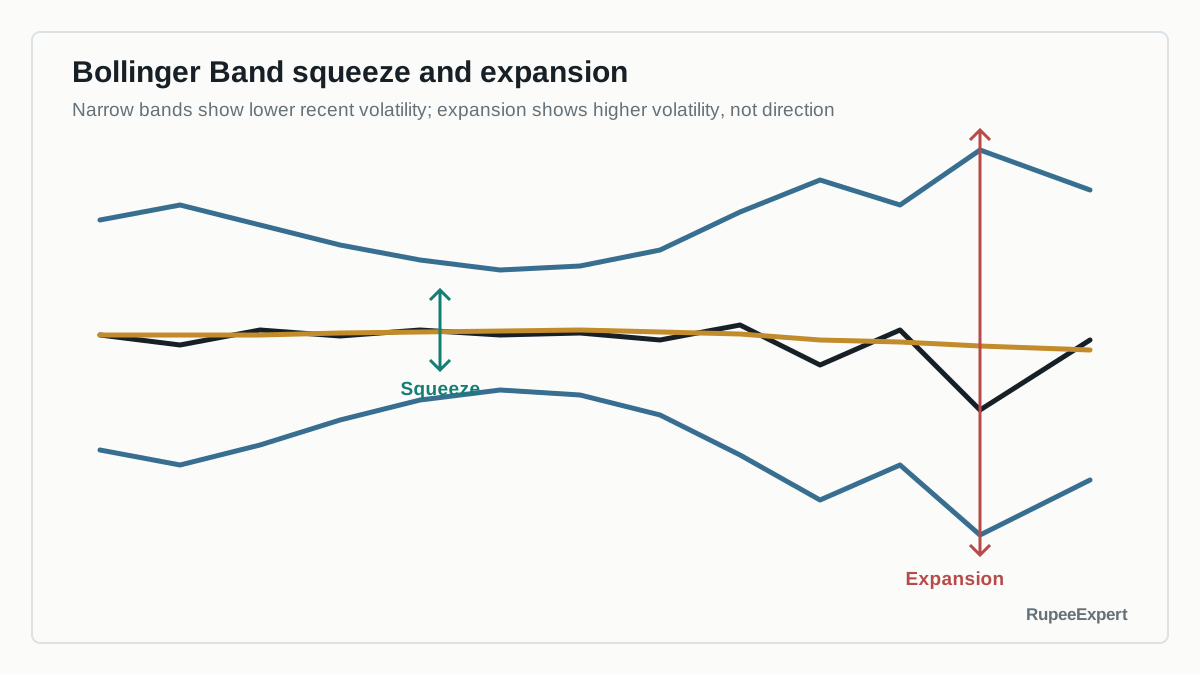
The most useful information in Bollinger Bands is the width between the upper and lower lines:
- Wide bands mean high volatility — the market is moving a lot.
- Narrow bands mean low volatility — the market is quiet.
Price spends most of its time within the bands, simply because being two standard deviations away is, by definition, unusual. So the bands give a sense of what counts as a "normal" range right now versus an extreme.
How traders read them
A few patterns are commonly discussed:
- Touching a band. Price reaching the upper or lower band shows it is far from its recent average — stretched, but not necessarily about to reverse.
- The squeeze. When the bands narrow dramatically, volatility has collapsed.
Band settings are not universal. Shorter windows react faster and produce more noise; longer windows change more slowly. Changing the number of standard deviations also changes how often price reaches a band. Any interpretation should state the settings and timeframe instead of treating the default as a law.
- Walking the band. In a powerful trend, price can hug one band and ride along it for an extended stretch, which catches out anyone who assumed a band touch meant "reverse now."
The limitations
This is where most people go wrong. Bollinger Bands describe volatility and relative position; they do not predict direction.
- A touch of the upper band is not a sell signal, and a touch of the lower band is not a buy signal. In trends, price can stay pinned to a band for a long time.
- The squeeze tells you a move may be coming, but not whether it will be up or down.
- Like all indicators, the bands are built from past prices and therefore lag the present.
Many traders combine Bollinger Bands with a momentum tool such as the RSI precisely because the bands alone say nothing about direction.
Common mistakes to avoid
- Treating band touches as automatic signals. The classic error, and an expensive one in trending markets.
- Ignoring the trend. Bands behave very differently in a trend than in a range.
- Assuming a squeeze predicts direction. It only hints at a coming change in volatility, not which way.
- Using them in isolation. Bands are most informative alongside other context, not as a standalone trigger.
Bottom line
Bollinger Bands turn volatility into a visible envelope around price: they widen when the market is busy, narrow when it is calm, and frame what counts as an extreme. Understanding how they are built — a moving average plus standard-deviation bands — lets you read any chart that shows them. But they describe the market's mood, not its future direction, and treating a band touch as a signal is a well-worn path to losses. As always here, this is education, not a trading recommendation.
Frequently asked questions
What do the three Bollinger Bands represent?
The middle band is a moving average (commonly a 20-period simple moving average). The upper and lower bands are placed a set number of standard deviations away from it — usually two. Together they form an envelope around price that expands and contracts with volatility.
What is a Bollinger Band squeeze?
A squeeze is when the bands narrow sharply because volatility has dropped. It signals a quiet, low-volatility period, which often precedes a larger move. Importantly, a squeeze does not tell you which direction the eventual move will take.
Does price touching the upper band mean sell?
No. A touch of the upper or lower band only means price is statistically far from its recent average. In a strong trend, price can ride along a band for a long time. Treating a band touch as an automatic buy or sell signal is a common and costly mistake.
Sources & further reading
Was this article helpful?