ADX (Average Directional Index), Explained
The ADX measures how strong a trend is — but not which way it points. Here's how it works alongside its +DI and −DI lines, and how traders read trend strength.
Most indicators try to tell you which way price is going. The ADX — Average Directional Index, developed by J. Welles Wilder — does something different and unusually honest: it tells you only how strong the current trend is, leaving the question of direction to other tools. That focus makes it a useful filter.
What the ADX measures
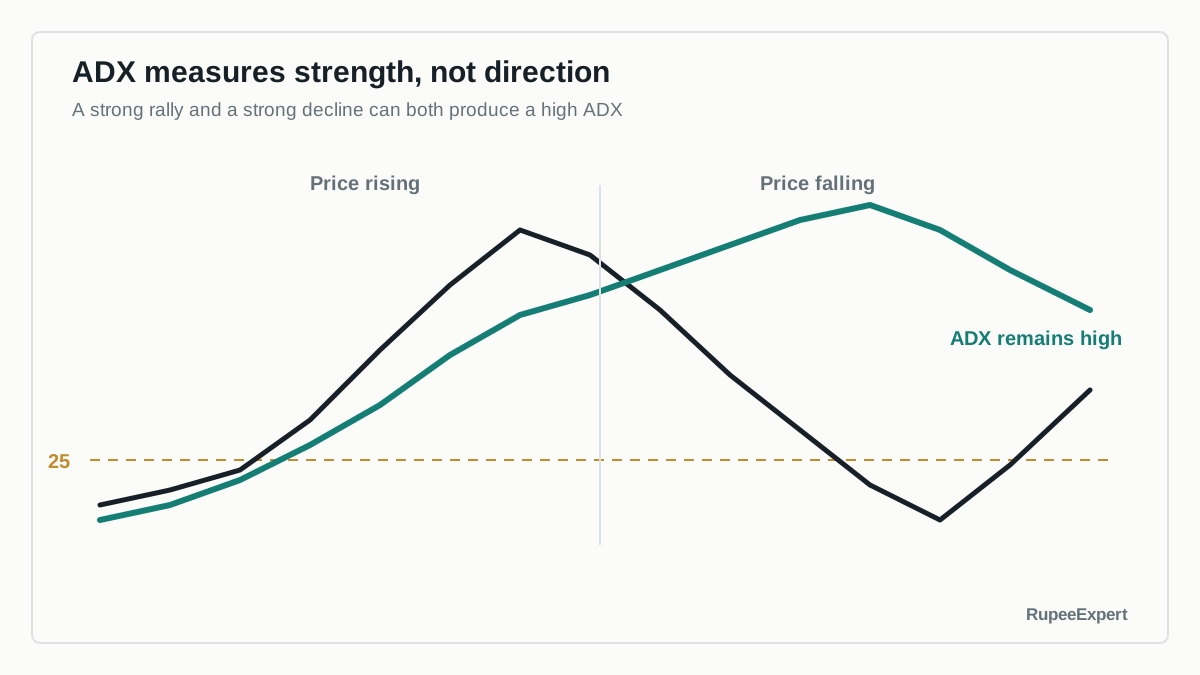
This is the key thing to internalise: a high ADX does not mean "go up" or "go down." It means the trend — whichever way it points — is strong. A market crashing hard and a market rallying hard can both produce a high ADX.
The direction lines: +DI and −DI
The ADX rarely travels alone. It is plotted with two companion lines that supply the direction it omits.
When +DI is above −DI, upward movement is dominating; when −DI is above +DI, downward movement is in control. So the pair answers "which way?", while the ADX answers "how strongly?".
How traders read it
The conventional interpretation uses rough thresholds:
- ADX below 20 — a weak trend or a ranging, sideways market.
- ADX above 25 — a trending market, with higher values meaning a stronger trend.
- A rising ADX — the current trend is strengthening; a falling ADX — it is weakening.
A common use is as a filter: trend-following tools tend to work better when the ADX is high (a real trend exists), while range-based approaches suit a low ADX. Many traders pair the ADX with a moving average or MACD for direction.
The period and timeframe change the meaning. A 14-period ADX on a five-minute chart describes a very different window from the same setting on a daily chart. Compare readings only within a consistent instrument, timeframe, and setup; an ADX value is not a universal score for ranking unrelated charts.
The limitations
- It lags. The ADX is smoothed and built from past data, so it confirms strength after a trend is underway rather than before.
- It says nothing about direction on its own. Read without +DI/−DI, a high ADX is ambiguous.
- Thresholds are not absolute. The 20/25 levels are conventions, not hard rules, and differ across markets and timeframes.
Common mistakes to avoid
- Reading a high ADX as bullish. It only signals strength, which could be a strong downtrend.
- Ignoring the DI lines. Without them, the ADX gives you only half the picture.
- Expecting early signals. As a lagging measure, it is better at confirming than anticipating.
- Trading the ADX in isolation. It is a filter and context tool, not a standalone trigger.
Bottom line
The ADX measures trend strength on a 0–100 scale and deliberately leaves direction to its +DI and −DI companions. Used together, they tell you whether a market is trending and who is in control — making the ADX a handy filter for deciding when trend-following makes sense. But it lags, its thresholds are conventions, and a high reading is never a buy signal by itself. This is educational only, not a trading recommendation.
Frequently asked questions
Does the ADX tell you whether to buy or sell?
No. The ADX measures only the strength of a trend, not its direction. A high ADX means a strong trend, but it could be strongly up or strongly down. Direction comes from the accompanying +DI and −DI lines, and even then it is context, not a signal.
What ADX value means a strong trend?
By common convention, an ADX above 25 is read as a trending market and below 20 as weak or range-bound, with higher values meaning stronger trends. These thresholds are guidelines, not precise rules, and they vary by market and timeframe.
What are the +DI and −DI lines?
They are the directional indicators that accompany the ADX. +DI reflects upward price movement and −DI reflects downward movement. When +DI is above −DI, buyers are more in control; when −DI is on top, sellers are. The ADX itself is derived from these two.
Sources & further reading
Was this article helpful?