The Stochastic Oscillator, Explained
The Stochastic Oscillator measures where price closes within its recent range to gauge momentum. Here's how its %K and %D lines work — and why 'overbought' doesn't mean 'sell'.
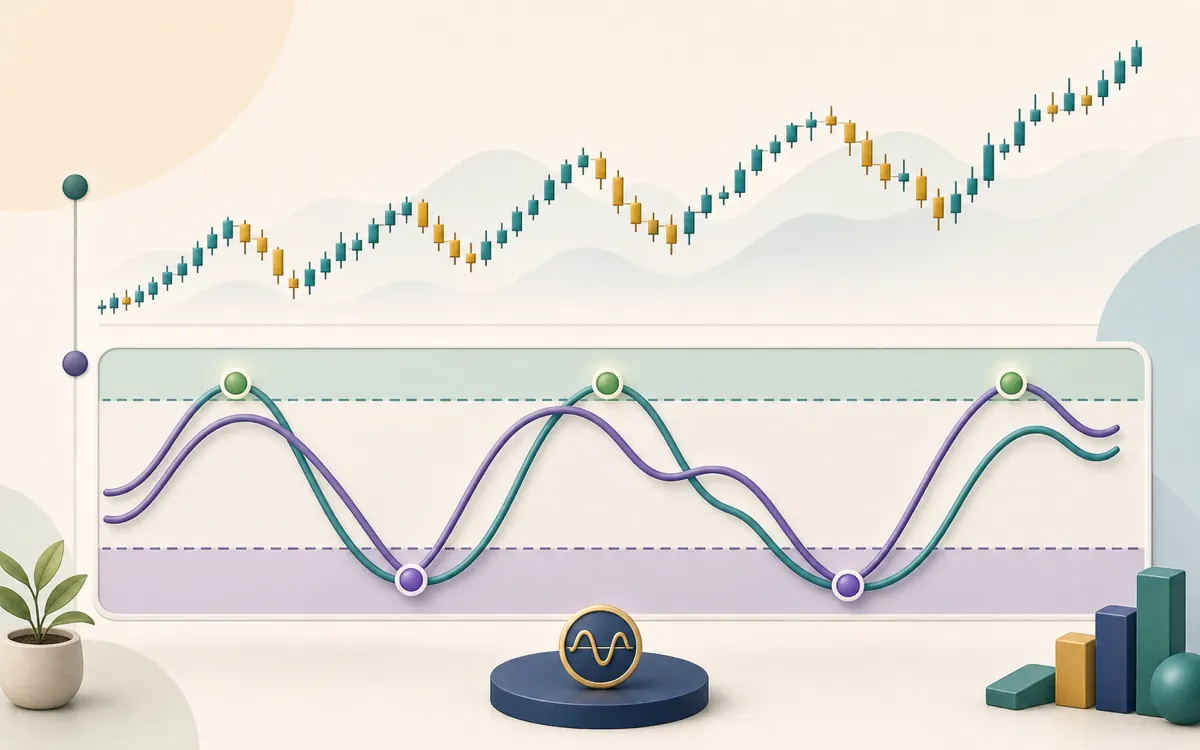
The Stochastic Oscillator, created by George Lane, is a momentum indicator built on a simple observation: in an up-move, prices tend to close near the top of their recent range, and in a down-move, near the bottom. By measuring exactly where the latest close sits in that range, it tries to capture the strength of momentum.
What it measures
If price closes right at the top of its recent range, the oscillator reads near 100. If it closes at the very bottom, it reads near 0. A reading of 50 means price closed in the middle of its range. The indicator is "bounded" — it always stays between 0 and 100 — which makes extremes easy to spot.
How it's calculated
The main line, %K, compares the latest close to the range over a chosen lookback period (commonly 14):
%K = 100 × (Close − Lowest Low) / (Highest High − Lowest Low)
%D = a short moving average of %K (commonly 3 periods)
Here, the highest high and lowest low are taken over the lookback window. The result is then smoothed into a second line, %D.
Overbought and oversold
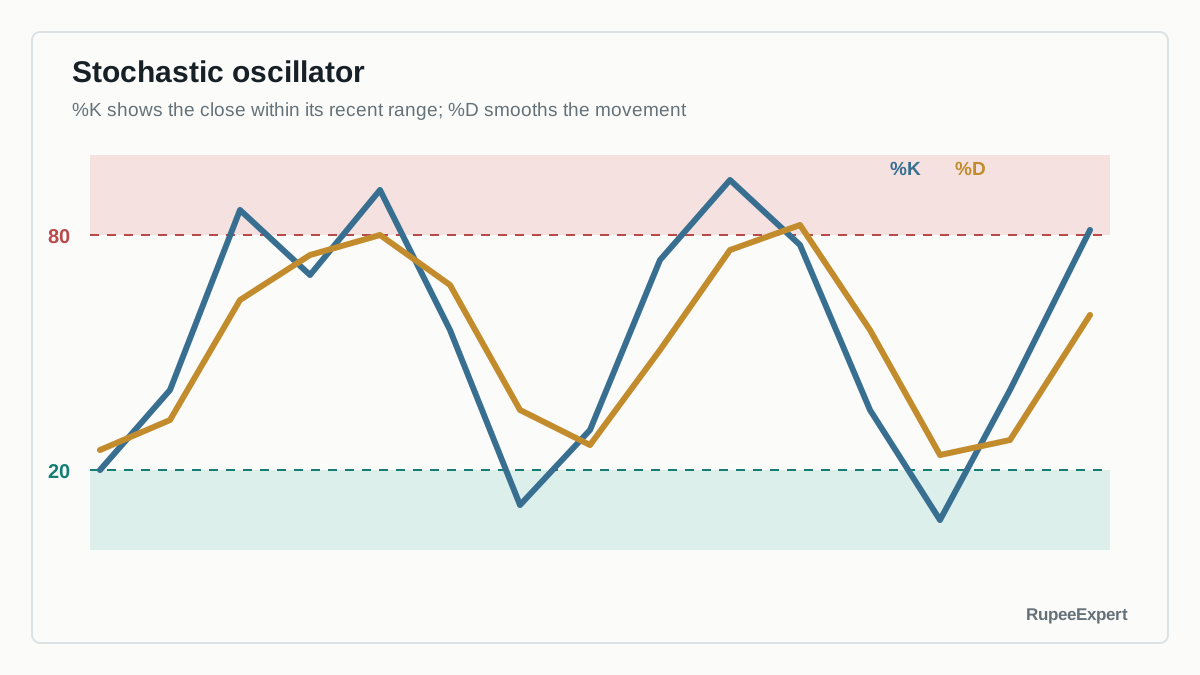
The Stochastic uses 80 and 20 as its conventional thresholds.
As with the RSI, the temptation is to read "overbought" as "sell" and "oversold" as "buy." Resist it. These are descriptions of where momentum has been, not predictions of where price will go next.
How traders read it
Commonly discussed patterns include:
- Crossovers. When %K crosses %D, some treat it as a shift in short-term momentum.
- Extreme readings. Time spent above 80 or below 20 flags stretched momentum.
- Divergence. When price makes a new high or low but the oscillator does not, some read it as momentum weakening.
The Stochastic often produces many crossings in a choppy market. Smoothing settings can reduce noise but also increase delay. A crossover therefore needs context from trend, price structure, and the chosen timeframe; more responsive settings are not automatically more informative.
The limitations
The Stochastic shares the weaknesses of every momentum oscillator:
- In a strong trend, it can stay overbought or oversold for a long time. Selling every "overbought" reading in a powerful uptrend would have you exiting far too early.
- Crossovers and extremes generate frequent false signals, especially in choppy markets.
- It is calculated from past prices, so it confirms rather than predicts.
This is why many traders use it alongside trend tools like moving averages rather than on its own.
Common mistakes to avoid
- Trading every overbought/oversold reading. The fastest way to lose money in a trending market.
- Ignoring the trend. The Stochastic behaves very differently in a range than in a strong trend.
- Relying on crossovers alone. They are noisy and unreliable in isolation.
- Expecting prediction. Like all indicators, it describes the past, not the future.
Bottom line
The Stochastic Oscillator captures momentum by asking a simple question: where in its recent range is price closing? Its %K and %D lines, bounded between 0 and 100, make stretched momentum easy to see. But "overbought" is not "sell," it gives plenty of false signals, and it cannot predict the future. Understanding how it is built lets you read it sensibly — as one piece of context, not a trading signal. This is educational only, not a recommendation.
Frequently asked questions
What does the Stochastic Oscillator measure?
It measures where the most recent closing price falls within the high-to-low range of a chosen period (commonly 14). A high reading means price is closing near the top of its recent range; a low reading means it is closing near the bottom. The idea is to gauge momentum.
What are the %K and %D lines?
%K is the raw oscillator value calculated from the recent range. %D is a short moving average of %K, used as a smoother signal line. Crossovers between the two are among the patterns traders watch, though they are not reliable signals on their own.
How is the Stochastic different from the RSI?
Both are momentum oscillators on a 0–100 scale, but they measure different things. The RSI compares the size of recent gains and losses, while the Stochastic looks at where price closes within its recent range. They often broadly agree but can diverge, and neither predicts the future.
Sources & further reading
Was this article helpful?