Fibonacci Retracement, Explained
Fibonacci retracement marks potential pullback levels within a trend using ratios derived from a famous number sequence. Here's how it's drawn, read, and why it's not magic.
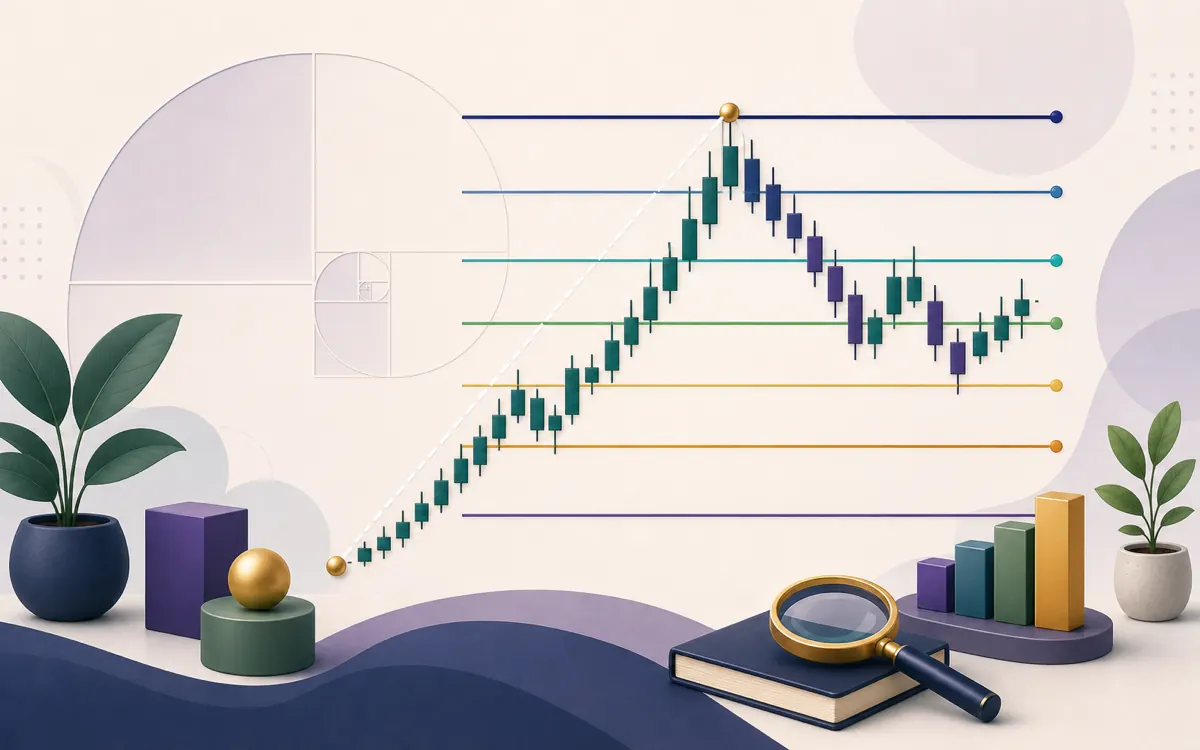
Fibonacci retracement is one of the more exotic-looking tools on a chart — a ladder of horizontal lines at oddly specific percentages. Behind the mystique is a simple idea: after a strong move, prices often pull back part of the way before continuing, and these levels try to mark where that pullback might pause.
What it is
The idea is that a trend rarely moves in a straight line. It advances, then retraces (pulls back) some of that move, then often continues. Fibonacci retracement attempts to flag the levels where that retracement might find support in an uptrend (or resistance in a downtrend).
Where the numbers come from
The ratios trace back to the Fibonacci sequence — 0, 1, 1, 2, 3, 5, 8, 13, and so on, where each number is the sum of the two before it. Divide numbers in the sequence and you keep getting ratios near 61.8% (the "golden ratio") and 38.2%.
The 23.6% and 78.6% levels come from related ratios, while the 50% level is added by tradition — it is not actually a Fibonacci ratio, but many traders watch it because a halfway pullback is psychologically significant.
How traders use it
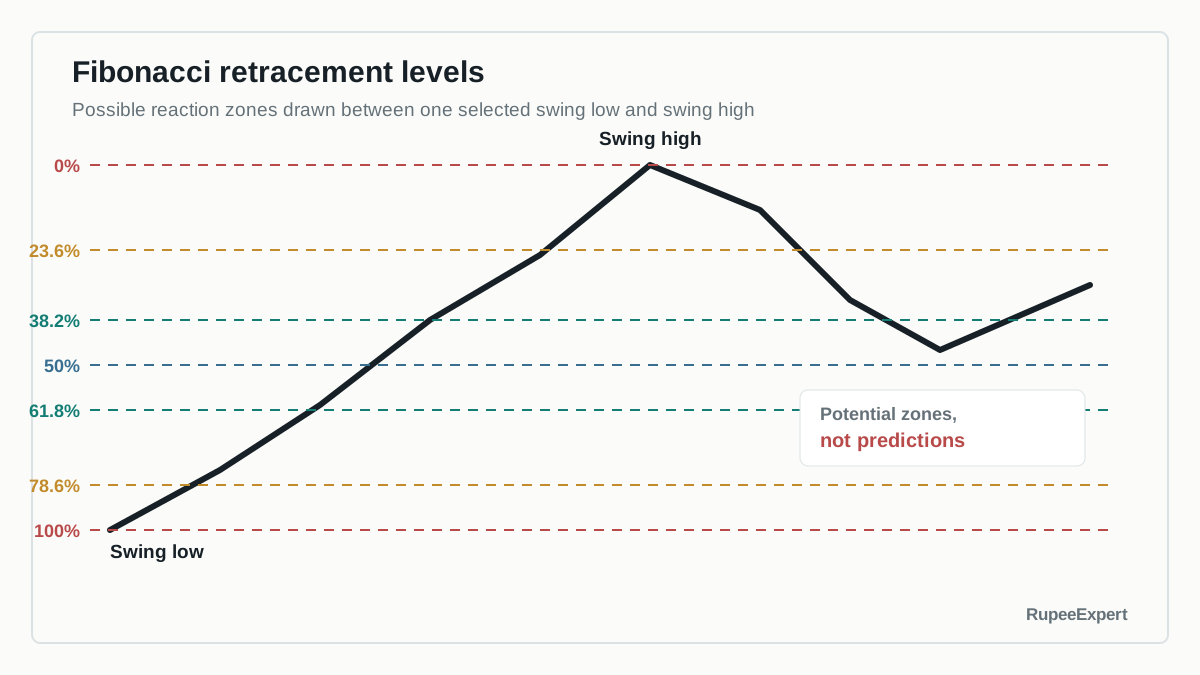
To apply the tool, you select a meaningful swing low and swing high of a move, and the levels are drawn between them. Then:
- In an uptrend, the retracement levels below the high are watched as possible support during a pullback.
- In a downtrend, the levels above the low are watched as possible resistance during a bounce.
- The 61.8% and 38.2% levels get the most attention.
Many traders combine these levels with support and resistance or a moving average; when a Fibonacci level lines up with another signal, they consider it more meaningful.
That overlap is often called confluence, but it does not turn several subjective tools into certainty. If swing points are chosen only after seeing the outcome, the chart may simply be fitted to the past. An honest review records the swing points and rule before judging whether the level helped.
The limitations
This is where honesty matters:
- It is subjective. Different traders pick different swing points, producing different levels. There is no single "correct" drawing.
- It is partly self-fulfilling. Levels sometimes "work" simply because so many people place orders around them, not because of any natural law.
- It does not predict. A retracement level is a zone of possible interest, never a guarantee of a reversal. Price often slices straight through.
Common mistakes to avoid
- Treating levels as precise lines. They are zones, and price routinely overshoots or undershoots them.
- Forcing the tool onto every chart. It is most useful within a clear trend, not in choppy, directionless markets.
- Using it alone. Fibonacci levels carry more weight when they coincide with other evidence, not in isolation.
- Cherry-picking swing points to make the levels fit what you already believe.
Bottom line
Fibonacci retracement marks potential pullback levels within a trend using ratios drawn from a famous sequence. It can highlight zones where price has a tendency to pause — partly because so many traders watch the same lines. But the levels are subjective, self-fulfilling at best, and never predictive. Treat them as one piece of context among many, not a crystal ball. This is educational only, not a trading recommendation.
Frequently asked questions
Where do the Fibonacci ratios come from?
They come from the Fibonacci number sequence, where each number is the sum of the previous two. Ratios between numbers in the sequence settle around 61.8% (often called the golden ratio) and 38.2%, which is why those percentages appear on the tool. The 50% level is added by convention, even though it is not a true Fibonacci ratio.
How do you draw a Fibonacci retracement?
You pick a significant swing low and swing high (or vice versa) and the tool draws horizontal lines at the key percentages of that move. Those lines mark price levels where a pullback within the trend might pause or reverse.
Do Fibonacci levels actually work?
They sometimes coincide with areas where price reacts, but much of that may be because so many traders watch the same levels that their orders cluster there — a self-fulfilling effect. The levels are zones of interest, not reliable predictions, and choosing different swing points gives different levels.
Sources & further reading
Was this article helpful?