Support and Resistance, Explained
Support and resistance are the floors and ceilings of a price chart — the most fundamental idea in technical analysis. Here's how they form, how they're used, and how they break.
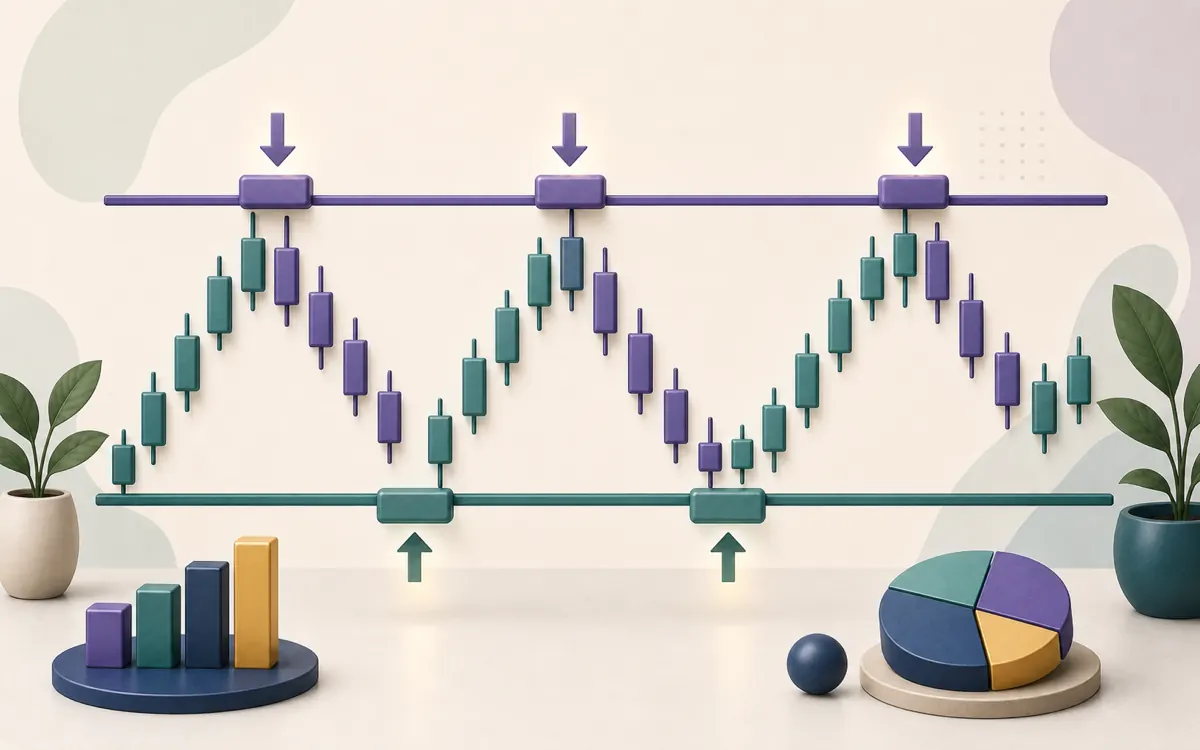
Before any oscillator or moving average, there is support and resistance. It is the most fundamental concept in technical analysis — the idea that prices remember where they have been, and that certain levels act like floors and ceilings. Almost every other tool builds on this foundation.
What they are
In an uptrend, price climbs until it hits resistance and may stall; in a downtrend, it falls until it reaches support and may steady. These levels are not magic numbers — they are simply prices where, historically, enough buyers or sellers have shown up to change the direction.
Why they form
The deeper reason is market memory. Suppose a stock repeatedly bounced from ₹500. Traders remember that, expect it to happen again, and place buy orders near ₹500 — which makes the bounce more likely. The same logic creates resistance overhead. In this way, support and resistance can become partly self-reinforcing: people act on them, which helps them hold.
This psychology is also why round numbers (₹100, ₹500, ₹1,000) often act as support or resistance — they are simply levels many people pay attention to.
They are zones, not lines
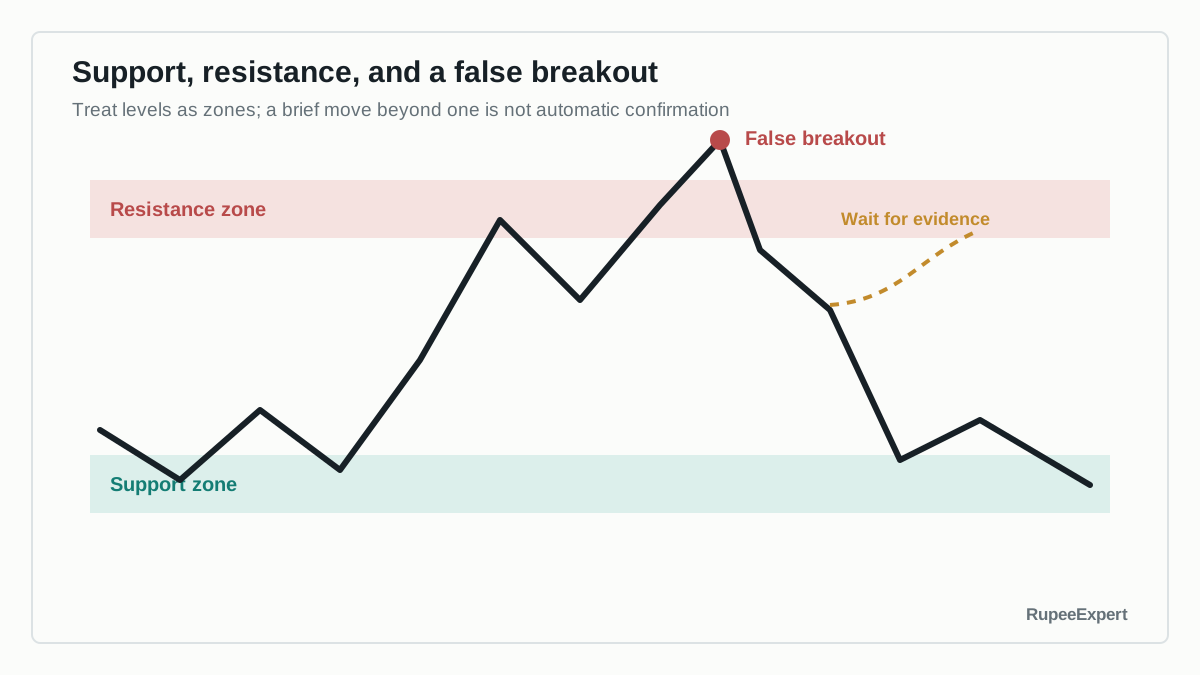
A common beginner error is to treat support and resistance as exact prices. In reality they are zones — a band of prices, not a single line. Price often pokes slightly past a level before reversing, or pauses just short of it. Thinking in zones rather than precise numbers leads to far fewer surprises.
Breaks and role reversal
Levels do not hold forever. When price pushes decisively through one, it "breaks," and an important behaviour often follows.
Breaks are also where traps happen — a "false breakout" occurs when price briefly pierces a level and then snaps back, catching out those who acted on the break. This is why many traders wait for confirmation rather than reacting to the first touch.
Confirmation has no single definition. It might mean a close beyond the zone, follow-through in a later period, or increased volume, but each choice adds delay and can still fail. State the rule in advance; otherwise almost any outcome can be explained after the fact.
How they're used
- Framing the chart. Support and resistance map out the meaningful levels, giving structure to everything else.
- Combining with other tools. A Fibonacci level or a moving average that lines up with support is watched more closely than either alone.
- Managing risk. Many traders reference these levels when deciding where a trade idea would be proven wrong.
Common mistakes to avoid
- Treating levels as exact prices rather than zones.
- Acting on the first touch of a break, before any confirmation — false breakouts are common.
- Drawing too many levels until the chart is meaningless; the clearest levels are the ones tested repeatedly.
- Forgetting the trend. Support is more likely to hold in an uptrend than in a collapsing market.
Bottom line
Support and resistance describe the floors and ceilings that price returns to, formed by market memory and reinforced by the traders who watch them. They are zones rather than exact lines, they can break, and a broken level often reverses its role. Master this idea and the rest of technical analysis makes far more sense — but remember it describes tendencies, not certainties. This is educational only, not a trading recommendation.
Frequently asked questions
What is the difference between support and resistance?
Support is a level below the current price where buying has tended to step in and stop further falls — a kind of floor. Resistance is a level above the current price where selling has tended to appear and cap rises — a ceiling. Both come from the price's history.
Why do support and resistance levels form?
They form from market memory. At a price where buyers previously stepped in, traders expect them to do so again, so orders cluster there. The same happens at levels where sellers previously appeared. This collective behaviour can make the levels somewhat self-reinforcing.
What does it mean when support becomes resistance?
When price breaks below a support level, that old floor often becomes a new ceiling — traders who missed selling there may sell on a return to it. This role reversal is a widely watched behaviour, though, like everything in technical analysis, it is a tendency and not a rule.
Sources & further reading
Was this article helpful?