What Is the Yield Curve? Bond Yields Explained Simply
The yield curve compares short-term and long-term bond yields. Learn what normal, flat, and inverted curves can suggest about rates and growth.
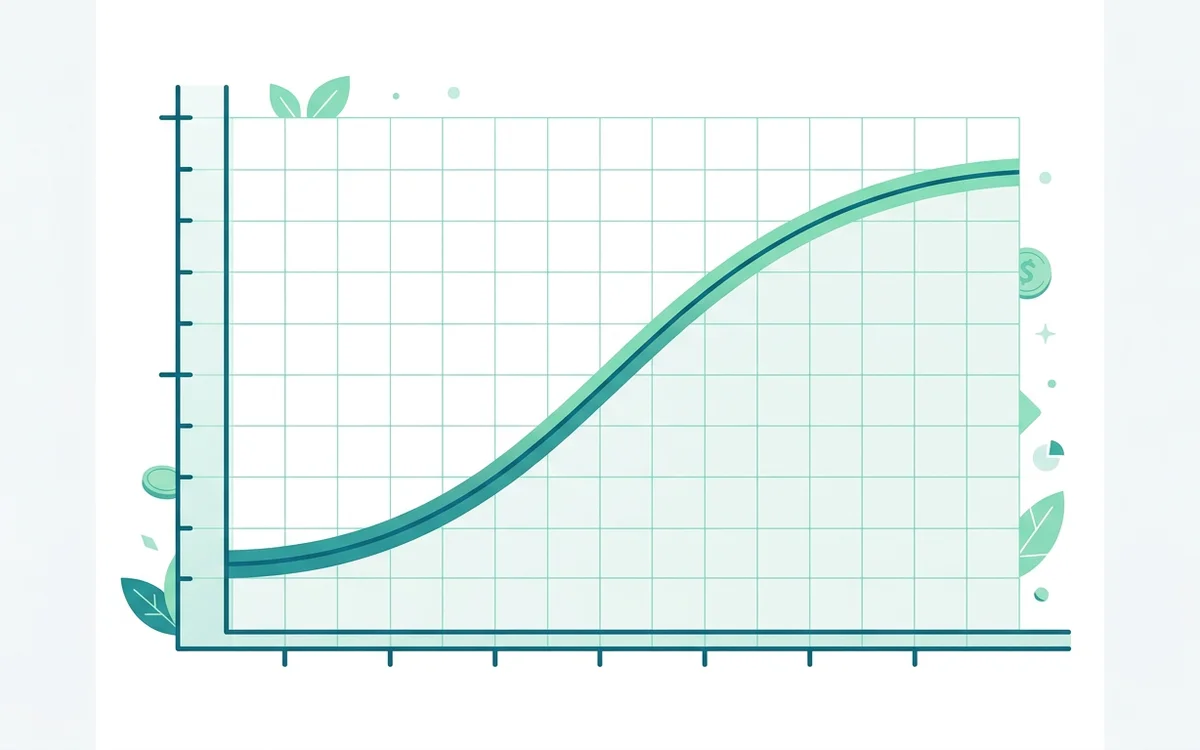
The yield curve is one of the most watched charts in fixed income. It looks technical, but the idea is simple: compare the interest rate investors demand for lending money over different time periods.
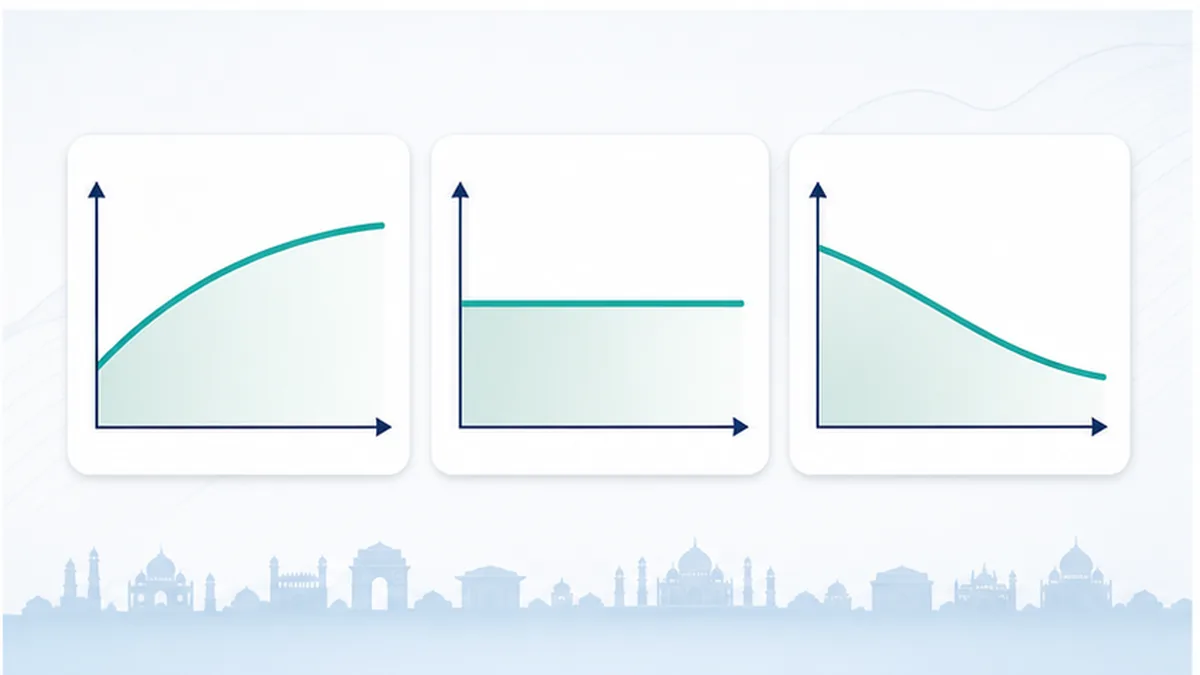
A normal yield curve
In a normal yield curve, short-term bonds have lower yields and long-term bonds have higher yields. This makes intuitive sense. Lending for 10 years is usually riskier than lending for 1 year because more can change: inflation, government borrowing, economic growth, currency value, and interest rates.
Longer bonds often need a higher yield to compensate investors for that uncertainty.
A flat yield curve
A flat curve means short-term and long-term yields are close to each other. This can happen when markets are uncertain. Investors may believe short-term rates are high now but could fall later, or they may be unsure about future growth.
A flat curve is not automatically bad, but it tells you that the bond market is not giving a strong reward for taking longer maturity risk.
An inverted yield curve
An inverted curve happens when short-term yields are higher than long-term yields. This can feel strange because investors are accepting lower yields for lending longer.
It can happen when markets expect future interest rates to fall, often because inflation may slow, growth may weaken, or the central bank may eventually cut rates. In some countries, an inverted yield curve has been watched as a recession warning, but it is not a guarantee.
Why investors should care
The yield curve affects:
- Debt mutual funds: Longer-duration funds are more sensitive to rate changes.
- Bond prices: When yields rise, existing bond prices usually fall.
- Loan and deposit rates: Market rate expectations can influence bank pricing over time.
- Asset allocation: A high long-term yield may make bonds more attractive, while a low yield may push investors toward other assets.
If you hold debt funds, duration matters. A long-duration fund can rise sharply when yields fall, but it can also fall when yields rise. That makes the yield curve useful for understanding risk, not for predicting the future perfectly.
Coupon, price, and yield
One confusing part of the yield curve is that bond yields are market returns, not always the coupon printed on the bond.
If market yields rise above a bond's coupon, the bond price usually falls so buyers can earn a competitive return. If market yields fall below the coupon, the bond price usually rises. This is the same inverse relationship explained in interest rates, inflation, and bonds.
A simplified curve example
Imagine government bond yields look like this:
| Maturity | Yield |
|---|---|
| 1 year | 6.6% |
| 5 years | 7.0% |
| 10 years | 7.2% |
That is a normal upward curve. Investors demand more yield for lending longer.
Now imagine this:
| Maturity | Yield |
|---|---|
| 1 year | 7.4% |
| 5 years | 7.1% |
| 10 years | 6.9% |
That curve is inverted. It may suggest markets expect policy rates to fall later, perhaps because inflation could cool or growth could weaken. It is a signal to investigate, not a trading rule.
How debt fund investors can use it
Debt fund investors should not try to predict every rate move. A more useful approach is to match duration to goal horizon:
- Money needed soon: prefer shorter-duration, lower-volatility debt choices.
- Medium-term goals: consider moderate duration only if volatility is acceptable.
- Long-term tactical debt allocation: understand that long duration can move sharply both ways.
A higher yield is not automatically a better deal. It may reflect longer maturity, lower liquidity, or higher credit risk.
What can change the curve?
The yield curve can shift for several reasons:
- RBI policy rate expectations.
- Inflation expectations.
- Government borrowing and bond supply.
- Global interest rates and currency pressure.
- Demand from banks, insurers, pension funds, and foreign investors.
- Risk appetite during uncertain periods.
Sometimes the whole curve moves up or down. Sometimes only short-term or long-term yields move. For example, if markets expect near-term rate cuts, short-term yields may fall faster. If investors worry about long-term inflation or fiscal pressure, long-term yields may stay high.
For everyday investors, the curve is best used as context. It helps explain why debt fund returns changed, why fixed deposit rates moved, or why long-duration bonds became volatile.
Common mistakes to avoid
- Thinking higher yield means better investment. Higher yield can also mean higher credit risk, duration risk, or liquidity risk.
- Ignoring maturity. A 10-year bond and a 1-year bond are not comparable only by yield.
- Treating curve signals as certainty. Yield curves are useful clues, not promises.
Bottom line
The yield curve shows what the bond market is demanding across time. A normal, flat, or inverted curve can reveal expectations about inflation, growth, and rates, but it should be used as a risk lens rather than a crystal ball.
Frequently asked questions
What does the yield curve show?
It shows the yields available on bonds of different maturities, usually from short-term to long-term.
Why is the yield curve usually upward sloping?
Longer-term bonds usually carry more uncertainty about inflation and rates, so investors often demand higher yields.
Is an inverted yield curve a guaranteed recession signal?
No. It can be a warning sign in some markets, but it is not a guarantee and should be read with other economic data.
How does the yield curve affect debt mutual funds?
Debt funds holding longer-duration bonds are more sensitive to yield changes. If yields fall, long-duration funds can gain; if yields rise, they can fall.
What is the difference between yield and coupon?
Coupon is the fixed interest a bond pays on face value. Yield is the return an investor expects based on the current market price and future cash flows.
Sources & further reading
Was this article helpful?